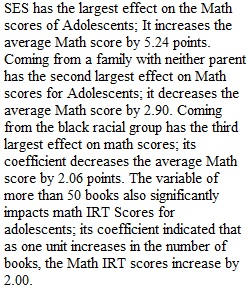


Q A copy of your assignment is in the link below: APPLICATION 4. Quantitative Analysis. Statistical Significance.FALL2022.pdf Download APPLICATION 4. Quantitative Analysis. Statistical Significance.FALL2022.pdf Quantitative analysis Quantitative analysis measures covariance among variables. If two variables have a statistical significant relationship, we may claim they covary. In quantitative studies, the authors test which of a set of independent variables (X variables) covary with the outcome of interest (the Y variable). When there is a significant statistical relationship – that is, a relationship that is not random, but is statistically shown to be a pattern – we use an asterisk to alert the reader of the covariation. After reading Southgate and Roscigno (2009), refer to Table 3 of the study for this assignment. Regression analysis measures each X variables’ effect on the Y. Table 3 is a regression Table that measures the effect of SES (Socioeconomic status), Family Structure, Race, Gender, Music Involvement, Cultural Capital, and Prior Achievement on Math Scores. SES (Socioeconomic status), Family Structure, Race, Gender, Music Involvement, Cultural Capital, and Prior Achievement are all Xs. SES=X1, Family Structure=X2, Race=X3, Gender=X4, Music Involvement=X5, Cultural Capital=X6, and Prior Achievement=X7. When there is a statistical significant relationship, as we learned, there may be a covariation where X affects Y by increasing or decreasing Y. If there is no statistical significant relationship, no asterisk, we may not interpret the covariation (that means there is no covariation – no relationship between X and Y). Remember to follow the steps I outline in the module: first identify IF the measure is statistically significant (asterisk/s), second, if there is correlation identify the effect size (5 is larger than 2, for example), third, look at the coefficient's direction - positive means X increases Y, negative means X decreases Y. Assignment Create a regression Table using ONLY the variables that are statistically significant from Table 3., Model 1, panel A in Southgate and Roscigno (2009). Once you have created the Table, discuss which variable has the largest effect and which variable has the least effect (but do not include covariations that have no asterisks, these do not covary). I have provided an example using Table 3. Model 1, panel C below: SES 1.02*** Neither Parent -1.13** Hispanic -0.88** More than 50 Books 0.89*** Prior Achievement 0.73*** Discussion of the findings: Coming from a family with neither parent has the largest effect on Math scores, it decreases the average Math score by 1.13. Prior Achievement has the least effect on Math scores, it increases the average Math score by 0.73. Your assignment should be created in a Table with the Variables in one column and the coefficients with their asterisks in the second column. PreviousNext
View Related Questions